
Your Looker Studio Report Is Probably Lying to You — Here's How to Fix It
Dive Into Our Podcast
What Is Google Looker Studio — And Why Should You Care?
If you’ve ever typed what is Google Looker Studio in the Google, the only is this: it is a free cloud-based data visualization software that fetches data from GA4, Google Ads, BigQuery, and more than 800 other connectors to make interactive and shareable dashboards. Compared to competitors such as Tableau ($70/user/month) or Power BI Pro ($10/user/month), Looker Studio provides unlimited reports, unlimited data sources, and unlimited users at no cost – it’s an incredible value for marketing teams of any size.
The Looker Studio dashboard has become the standard for agencies and in-house teams doing custom analytics reports — from channel performance to multi-touch attribution. But free doesn't mean frictionless.
The Real Problems Marketers Face With Google Looker Studio
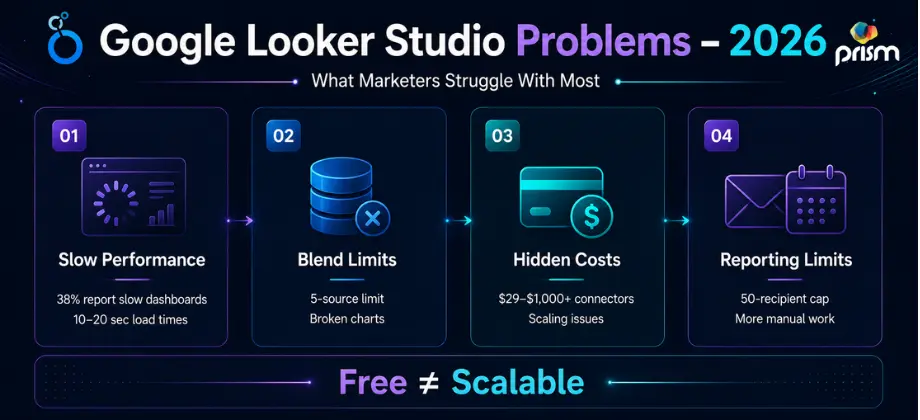
Let's call it like it is. Here are the most reported pain points — not opinions, but patterns backed by real user data.
The #1 Complaint: Slow Load Times
In last year's reviews, 38% users highlighted performance problems like slow dashboards, timeouts, & visualizations that take several seconds to render. The more data sources and blends in a report, the worse it gets. A 10-widget dashboard pulling from three sources can take 10–20 seconds to load — long enough for a stakeholder to assume something is broken.
And here's the kicker: Looker Studio Pro at $9/user/month does not fix slow load times. The performance issue is architectural — Pro adds governance features, not query speed.
Data Blending Hits a Hard Wall
Looker Studio limits data blending to five sources per blend. For marketing teams combining CRM, paid ads, SEO, email, and financial data, that ceiling is reached fast. When a schema changes upstream — a renamed column in Google Sheets or an updated field in a CRM — blends break without a useful error message. Your dashboard just shows empty charts, and you may not find out for days.
Third-Party Connectors Cost More Than You Think
Basic reporting is free, but third-party data connectors for non-Google platforms such as Facebook, LinkedIn, or HubSpot come with fees starting at $29 to more than $1,000/month. Small agencies with a handful of clients may find Looker Studio sufficient, but expanding agencies supporting dozens of clients across multiple platforms will almost always find the limitations too restrictive.
Email Scheduling Quietly Got Capped
In March 2025, Google introduced new restrictions on scheduled email delivery — each email is now limited to a maximum of 50 recipients, including Google Groups or aliases. This was a silent change that caught agencies and larger teams off guard mid-cycle.
What's New in Looker Studio — Updates Worth Knowing
Despite the gripes, Google Looker Studio has been shipping meaningful updates. Here's what matters most:
Gemini in Looker is now automatically enabled for Looker Studio Pro subscriptions created on or after June 3, 2025 — bringing AI-powered analysis, a natural language Formula Assistant, and a Code Interpreter that translates questions into Python for advanced visualizations.
The new Modern Charts public preview comes with a new chart styling, default configuration, and settings options which provide report creators more control over the curation and presentation of data.
In July 2025 three major elements were added: new A4 portrait and landscape canvas sizes for print-ready reports, an Applied Filters panel so viewers immediately know what's influencing each chart, and a report description field where editors can articulate context, update cadence, and audience guidance.
The Looker connector has been updated to allow for extraction of up to 75,000 rows of data – a huge increase in capacity, as previously there were limitations that did not allow for analysis of large data sets in Looker Studio reporting workflows.
Looker Studio: How to Use It Properly — Advanced Fixes That Actually Work
Here's the practical side — what separates a looker studio example that impresses from one that frustrates.
Speed Up Your Slow Dashboards: Keep charts to 25 per page — even Google recommends restricting the number of dashboard elements, as those with 25 or more tiles can experience performance that is slower than expected. Pre-aggregate your data in BigQuery or Google Sheets before it gets to Looker.
Fix Broken Blends: Do your data joining upstream before it reaches Looker Studio. Use Google Sheets as a clean data layer between your source and your Google data studio dashboard to avoid cascading blend errors.
Repair Connector Costs: Audit your usage. Native Google connectors (GA4, Google Ads, Search Console) are free and tightly integrated.Reserve paid connectors for platforms where the ROI is undeniable.
Fix Comparison Period Errors: Looker Studio defaults to comparing against the same calendar dates from the prior year — which means comparing a Thursday this year against a Wednesday last year. For businesses where day-of-week patterns matter, use case when statements to build separate calculated fields for accurate year-over-year comparisons.
Examples of a Looker Studio Dashboard That Drive Decisions
The best Google studio dashboard setups we've seen in agency environments share three traits: they're structured around one clear question per page, they use filters intelligently so clients can self-serve, and they connect paid, organic, and social data in a single view.
For looker studio reporting across SEO campaigns, our SEO Agency in Dubai builds dashboards that connect Search Console, GA4, and rank tracking data into a single performance narrative. For paid campaigns, our Paid Media Solutions team layers Google Ads, Meta, and LinkedIn into blended views that show true cost-per-lead across every channel. And for social strategy reporting, our Paid Social Media Marketing Plan clients get dashboards that track content performance, audience growth, and conversion attribution — all in one looker analytics view.
The Bottom Line on How to Use Looker Studio
Looker Studio remains one of the most powerful free tools in a marketer's stack — but only when it's built with intent. Know its limits. Pre-process your data. Keep dashboards lean. Layer in Gemini's new AI features where they save time. And when reporting complexity outgrows what the free tier can handle cleanly, that's the signal to bring in experts who live inside this data every day.
Your reports should tell a story that wins budget — not one that loads forever.

About The Author: Lovetto Nazareth
Lovetto Nazareth is a digital marketing consultant and agency owner of Prism Digital. He has been in the advertising and digital marketing business for the last 2 decades and has managed thousands of campaigns and generated millions of dollars of new leads. He is an avid adventure sports enthusiast and a singer-songwriter. Follow him on social media on @Lovetto Nazareth
![Top 10 Digital Marketing Companies for Real Estate Developers in UAE [2026]](https://d1jzpuh6ctcnd2.cloudfront.net/blogs/top-10-digital-marketing-companies-for-real-estate-developers-in-uae-2026/coverimage/8849adf2-e555-4e81-91ce-558218548e1c.webp)